
Carestream 360°
Carestream 360°
Comprehensive insights for Smarter Radiology Operations
Carestream 360º is an advanced analytics dashboard designed to help radiology departments track key performance metrics, analyze imaging trends, and optimize operational efficiency. It automatically collects critical data from all connected Carestream DR systems and consolidates it into a single, intuitive dashboard, providing a comprehensive view to drive smarter decision-making.

Discover Deeper Insights with Advanced Dashboard Tools
Carestream 360º is designed with interactive tools that allow you to filter, explore, and export data effortlessly, empowering you to gain insights faster, interact intuitively, and make informed, data-driven decisions.
- Filter with Ease – Quickly refine data using intuitive, pre-set filters that allow you to focus on the metrics that matter most.
- Drill-Down Analysis – Dive deeper into trends and performance metrics to support more informed decision-making.
- Exportable Cards – Easily extract key insights for sharing, reporting, or further analysis.

More Than Metrics - A Resource for Continuous Improvement
Carestream 360º provides powerful tools to help radiology teams understand, track, and improve image quality through advanced reject analysis.

The Story Behind the Stats
Get direct access to rejected images, enabling visual review that delivers deeper understanding and meaningful insights to guide smarter corrections.
In-Depth Analysis
Clear visuals make trends and problem areas easy to spot so, you can focus your efforts where they’ll have the greatest impact.
Smarter Collaboration
Review images and data together, providing a powerful tool for shared learning and collaborative coaching to build skills and enhance image quality.
Automated Reporting
Stay on top of QA with less effort—receive a monthly reject analysis report automatically by email, giving you the insights you need without the manual work. More time for improvement, less time chasing data.
Key Insights to Optimize Performance
Carestream 360º transforms complex performance metrics into clear, actionable insights through a series of intuitive dashboard pages. Designed for efficiency, it helps you:
Get a Quick Summary
The Overview Dashboard centralizes imaging and performance metrics to help you act faster, identify trends, and pinpoint areas for deeper investigation.
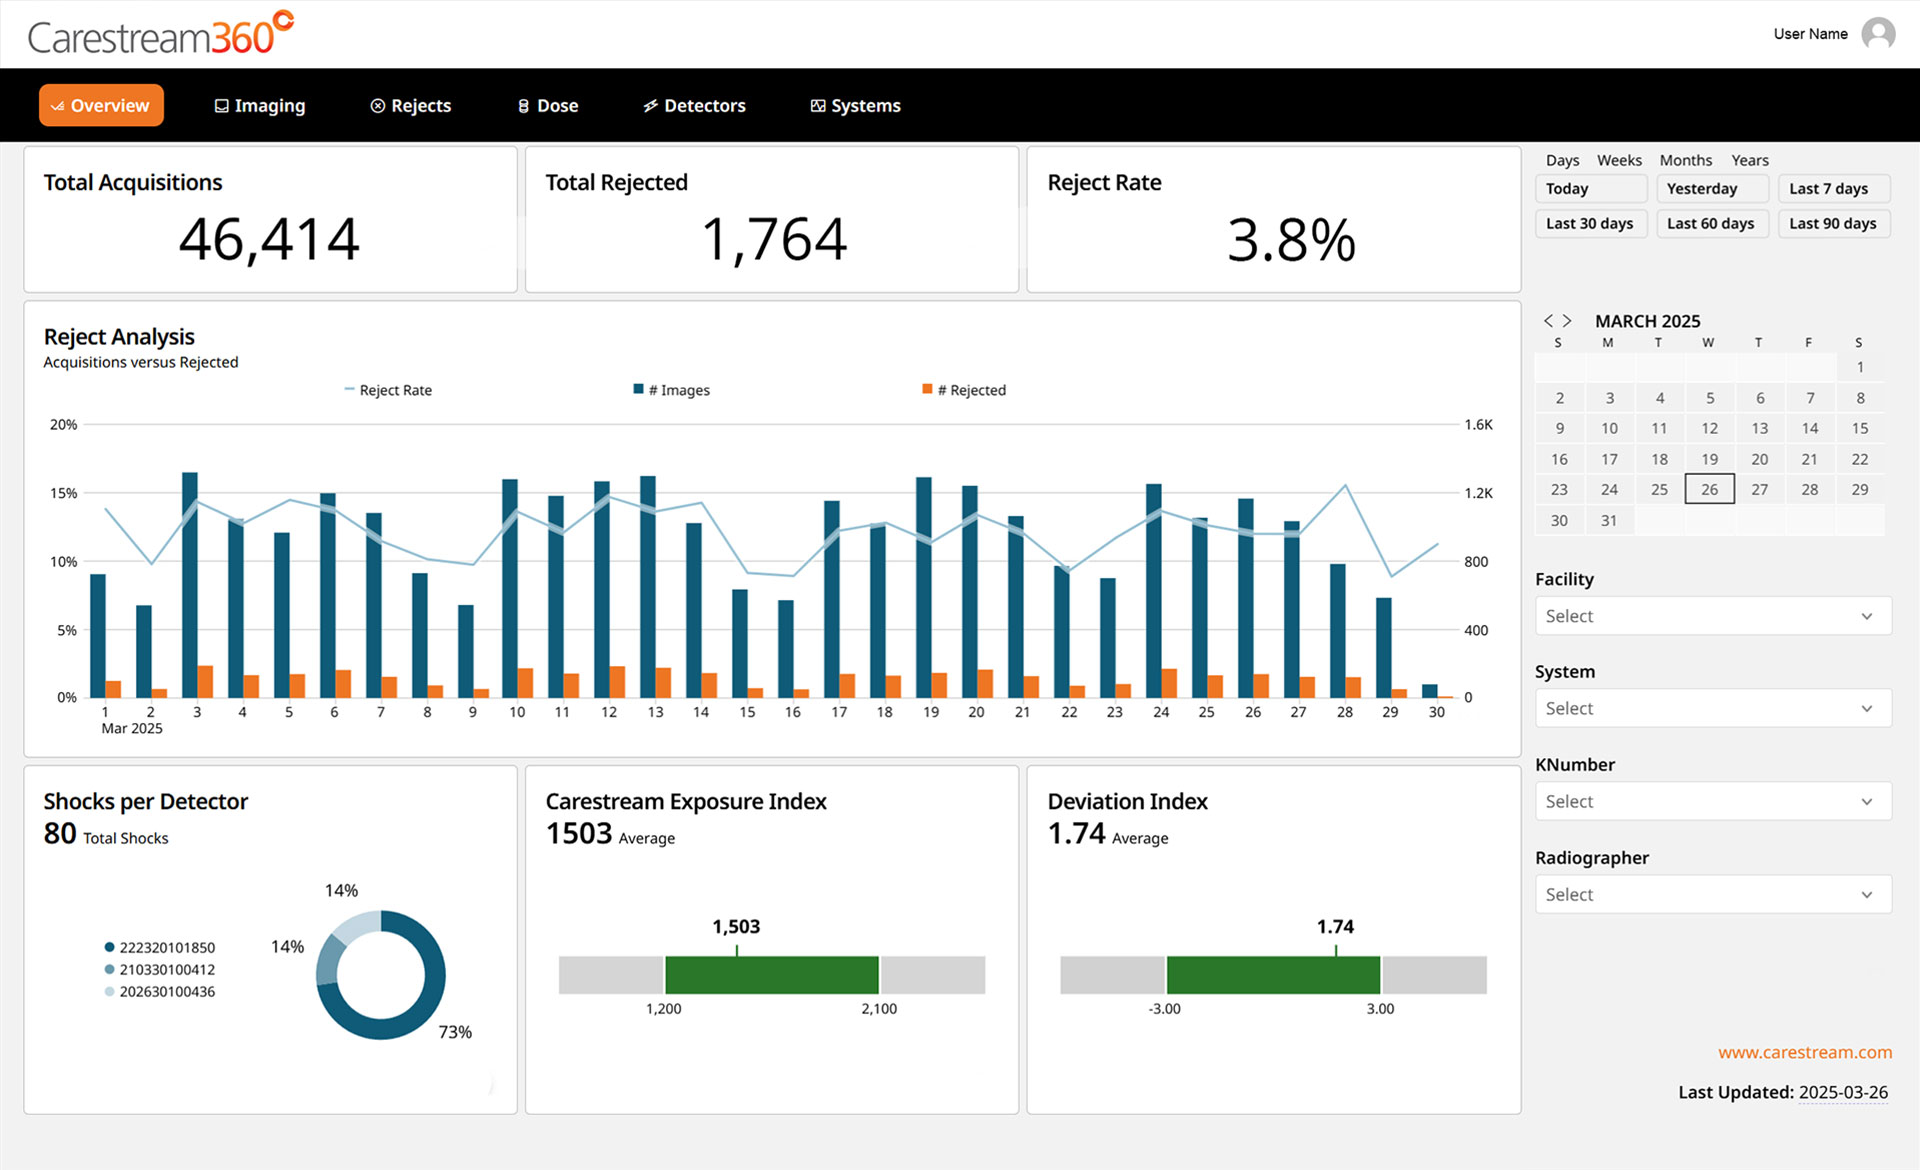
Track Key Metrics – View imaging volumes, reject rates, exposure levels, and shocks at a glance.
Spot Trends and Flag Issues Early – Identify shifts and patterns to pinpoint areas for improvement and guide timely actions.
Optimize Imaging Workflow
Gain insights to improve operations, balance staff workloads, and streamline scheduling for maximum efficiency.
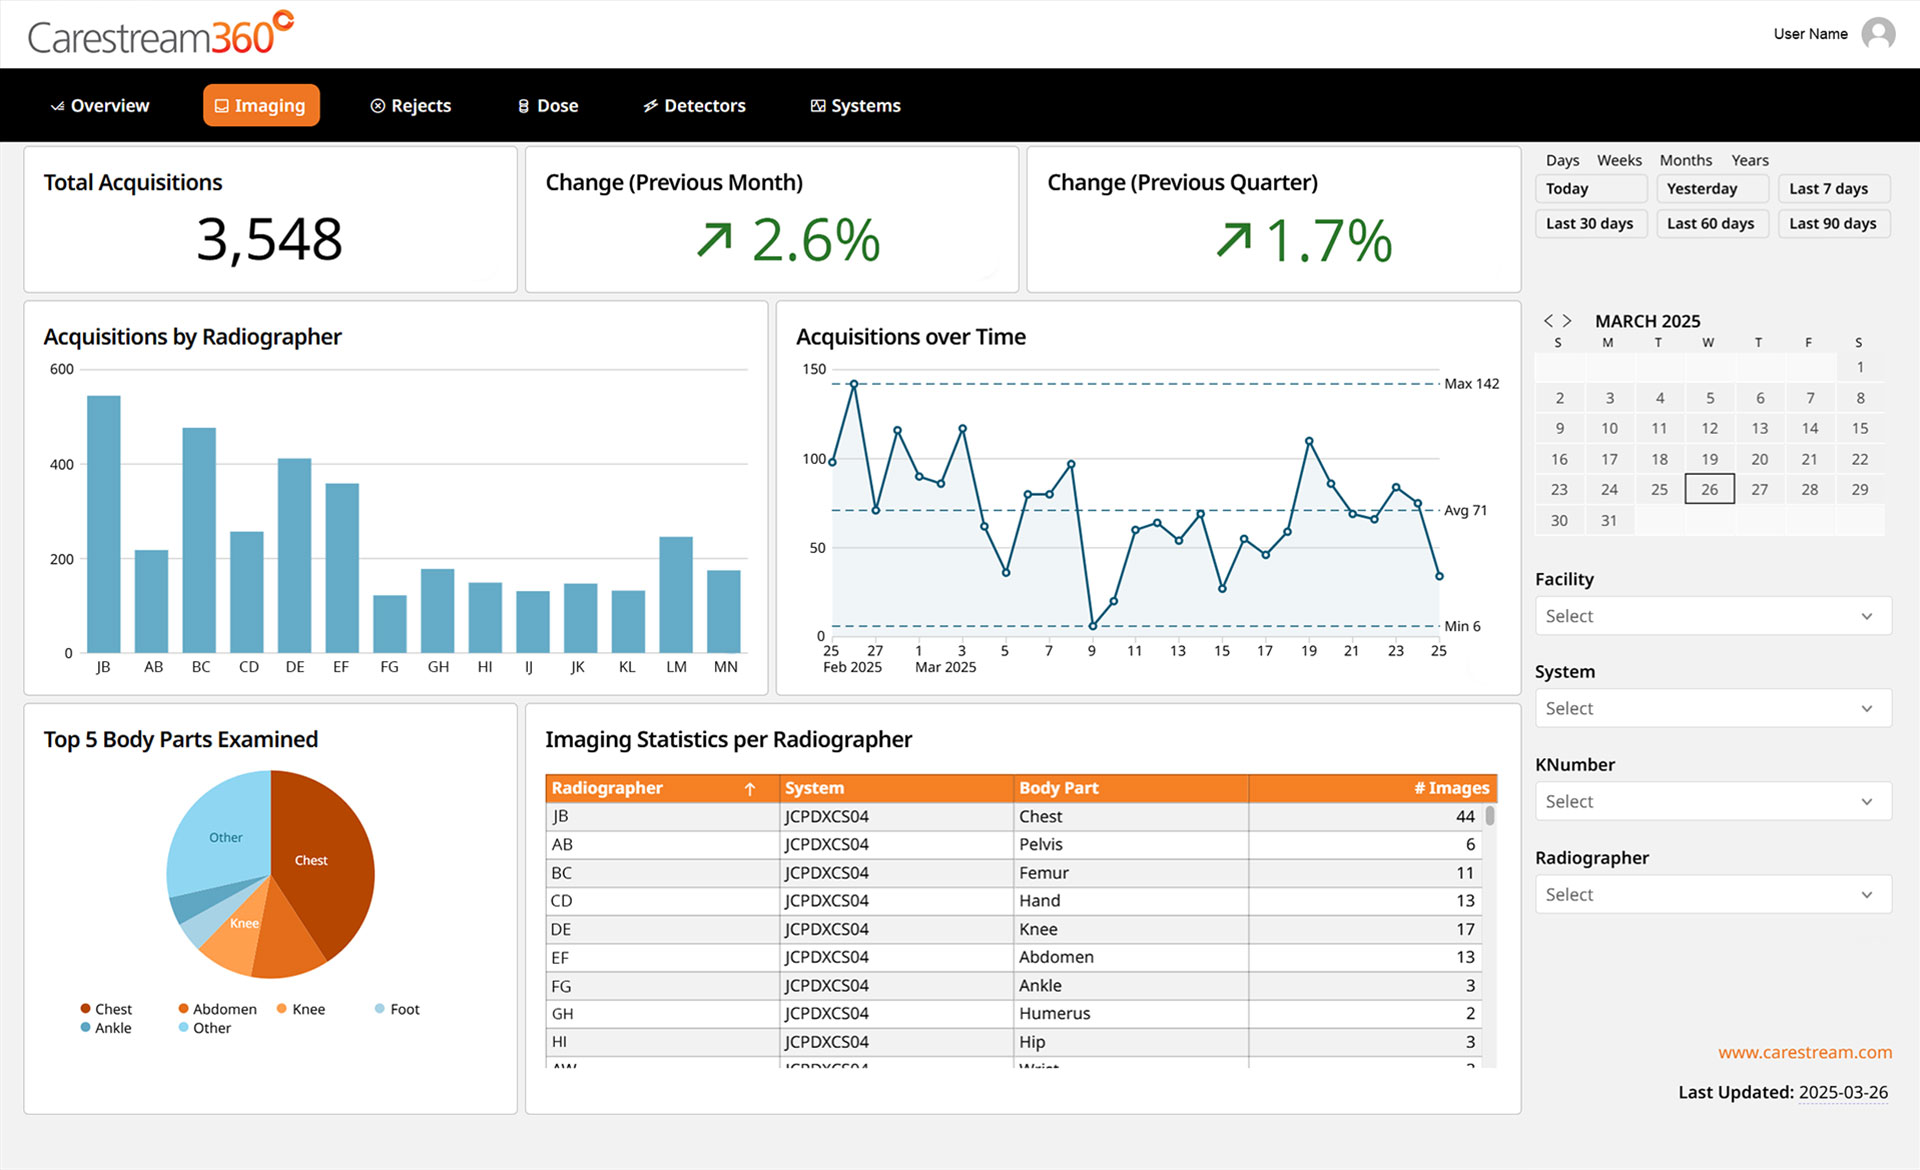
Monitor Productivity – Track acquisition volumes over time to optimize staffing and workload distribution.
Support Radiographers – Evaluate performance data to guide training and maintain a balanced workload across the team.
Analyze Procedure Trends – Identify high-demand exams and adjust resources to ensure efficient operation.
Boost Skills and Enhance Performance
Gain detailed insights into reject rates, trends, and contributing factors to enhance image quality and optimize team performance.
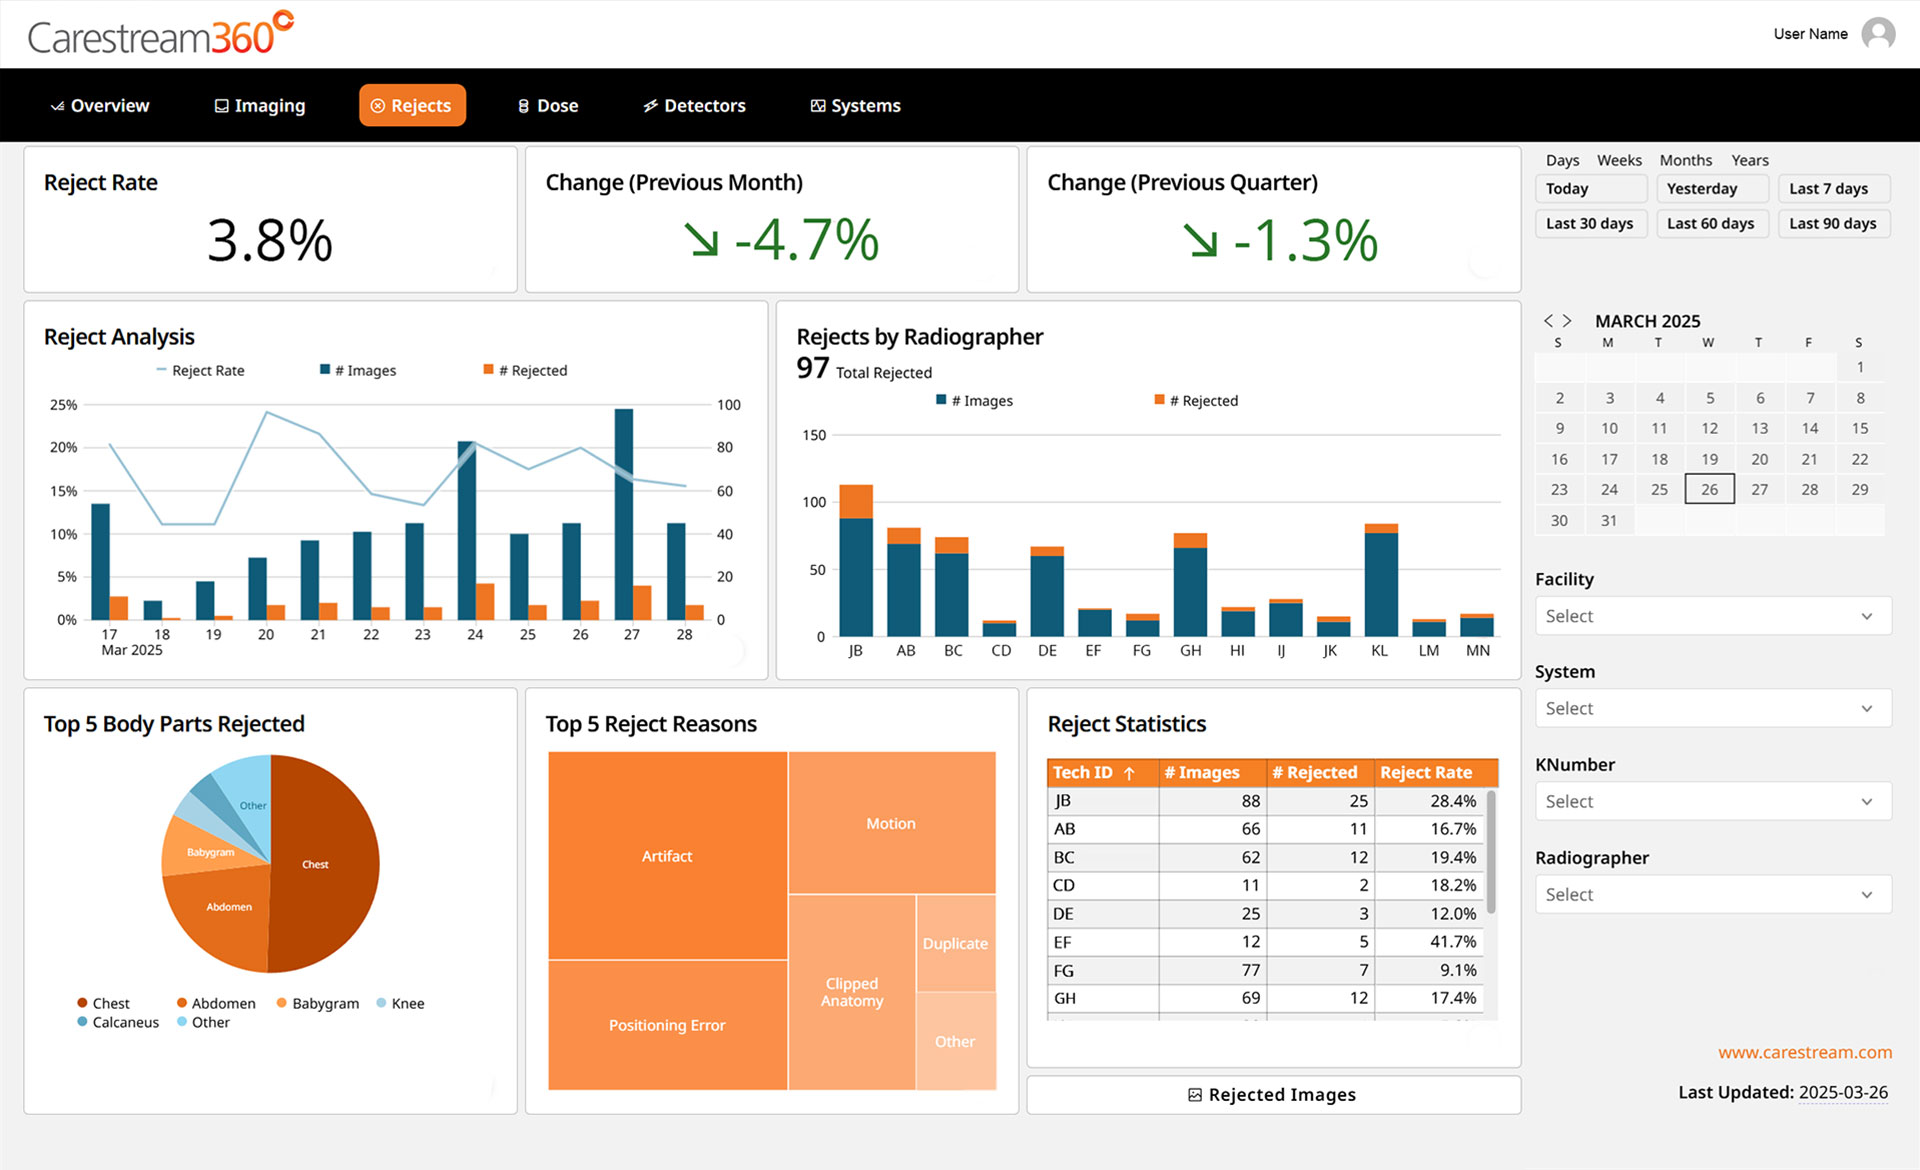
Track Reject Rates – Monitor trends to identify areas for improvement, reduce repeats, and enhance diagnostic confidence.
Analyze Rejects and Review Images – View rejected images to pinpoint issues, guide training, and drive continuous skill development.
Identify Top Reject Reasons – Focus on key rejection causes to optimize training and improve consistency across the team.
Optimize Dose and Image Quality
Keep exposure levels in check with clear visuals and easy-to-read indicators, ensuring safety and consistent image quality.
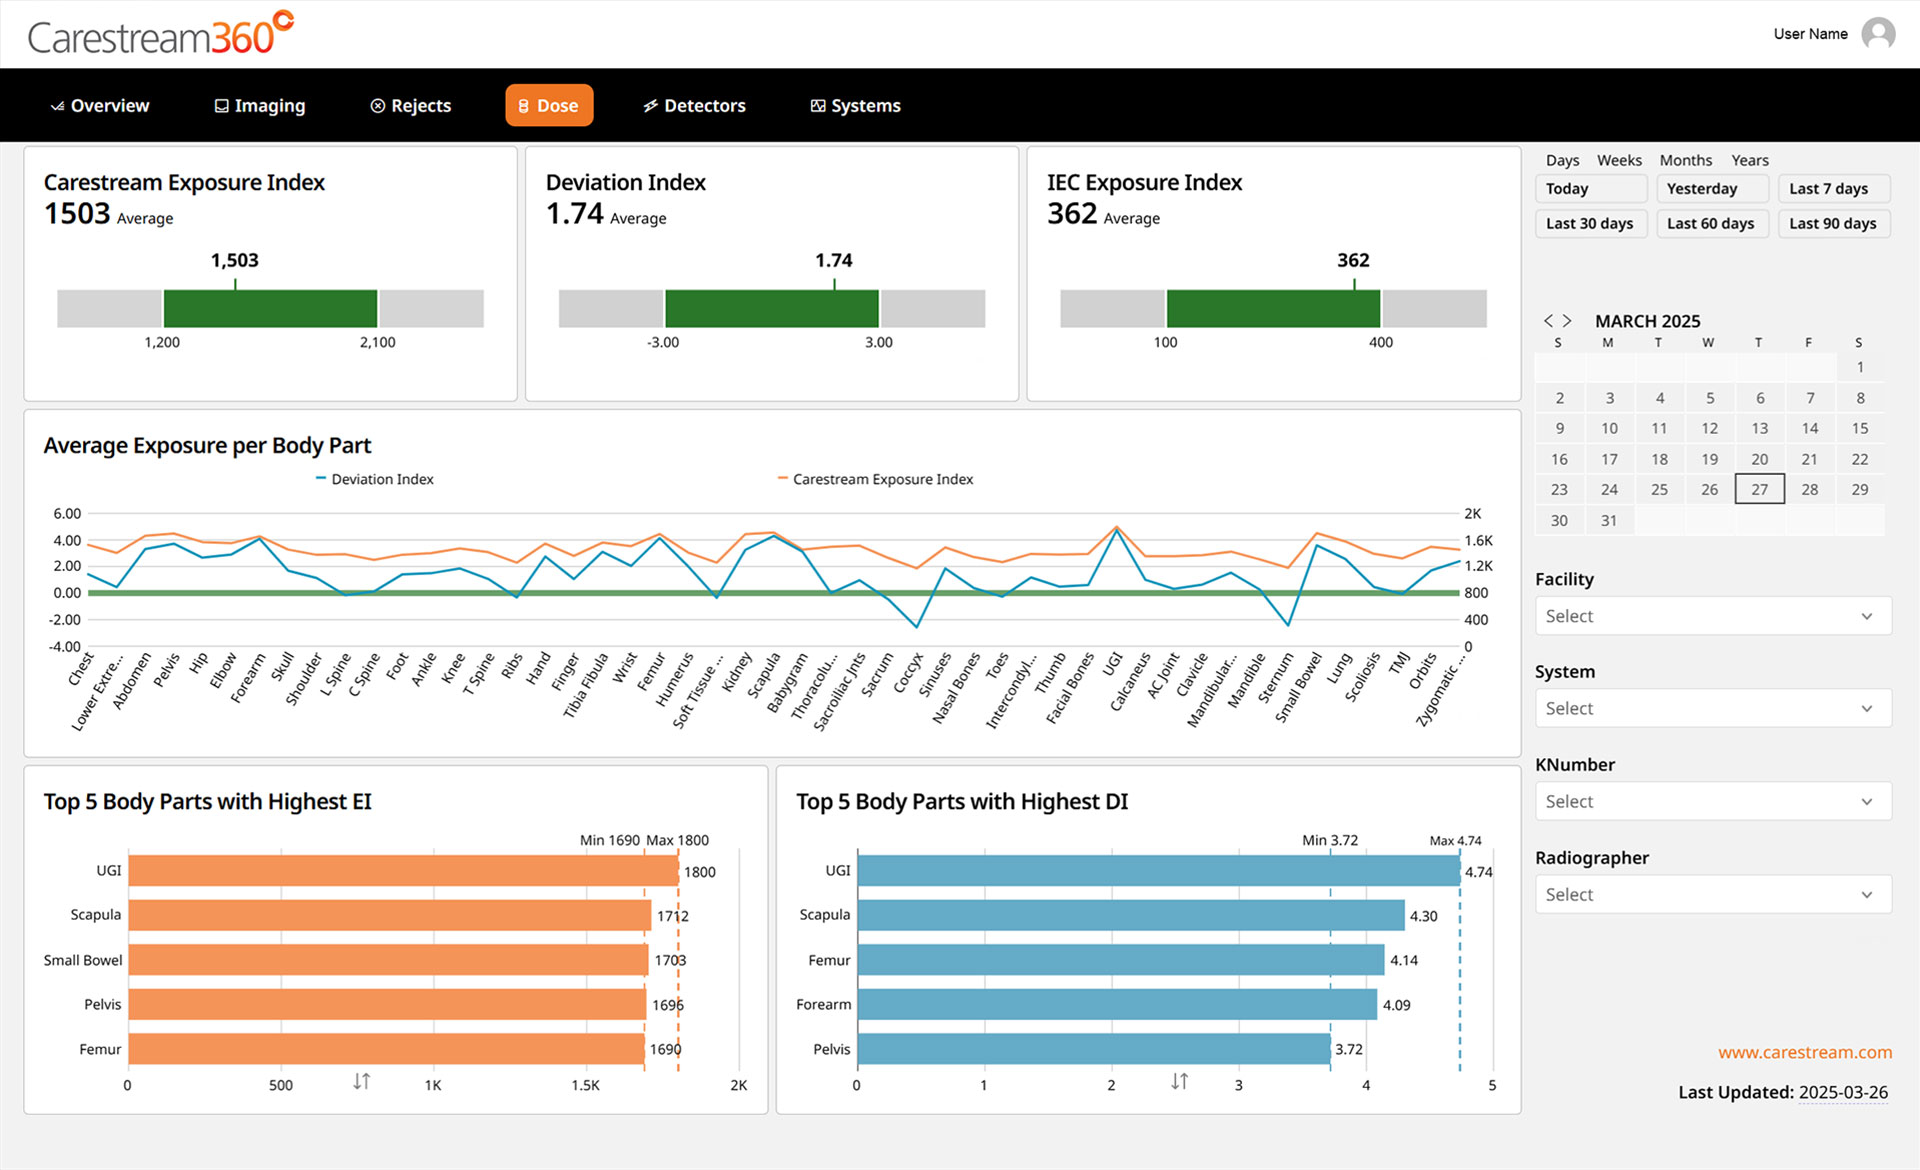
Visual Dose Indicators – Quickly assess EI and DI values to confirm they stay within the recommended range.
Track by Anatomy – Monitor exposure trends for specific body parts to ensure consistency.
Identify Outliers – Highlight areas where dose levels may need corrective action to improve image quality.
Protect and Optimize Your Detectors
Ensure proper care and reduce risk with insights into detector performance, usage, and calibration.

Detect Shock Events – Identify detectors at risk from mishandling to prevent downtime.
Balance Usage – View usage trends to ensure even distribution across detectors, extending lifespan and improving ROI.
Track Rejects and Calibration – Monitor reject rates and calibration status to ensure optimal operation and consistent quality.
Streamline System Management
Get a comprehensive view of system use, resource allocation, and staff workload distribution to ensure optimal performance.
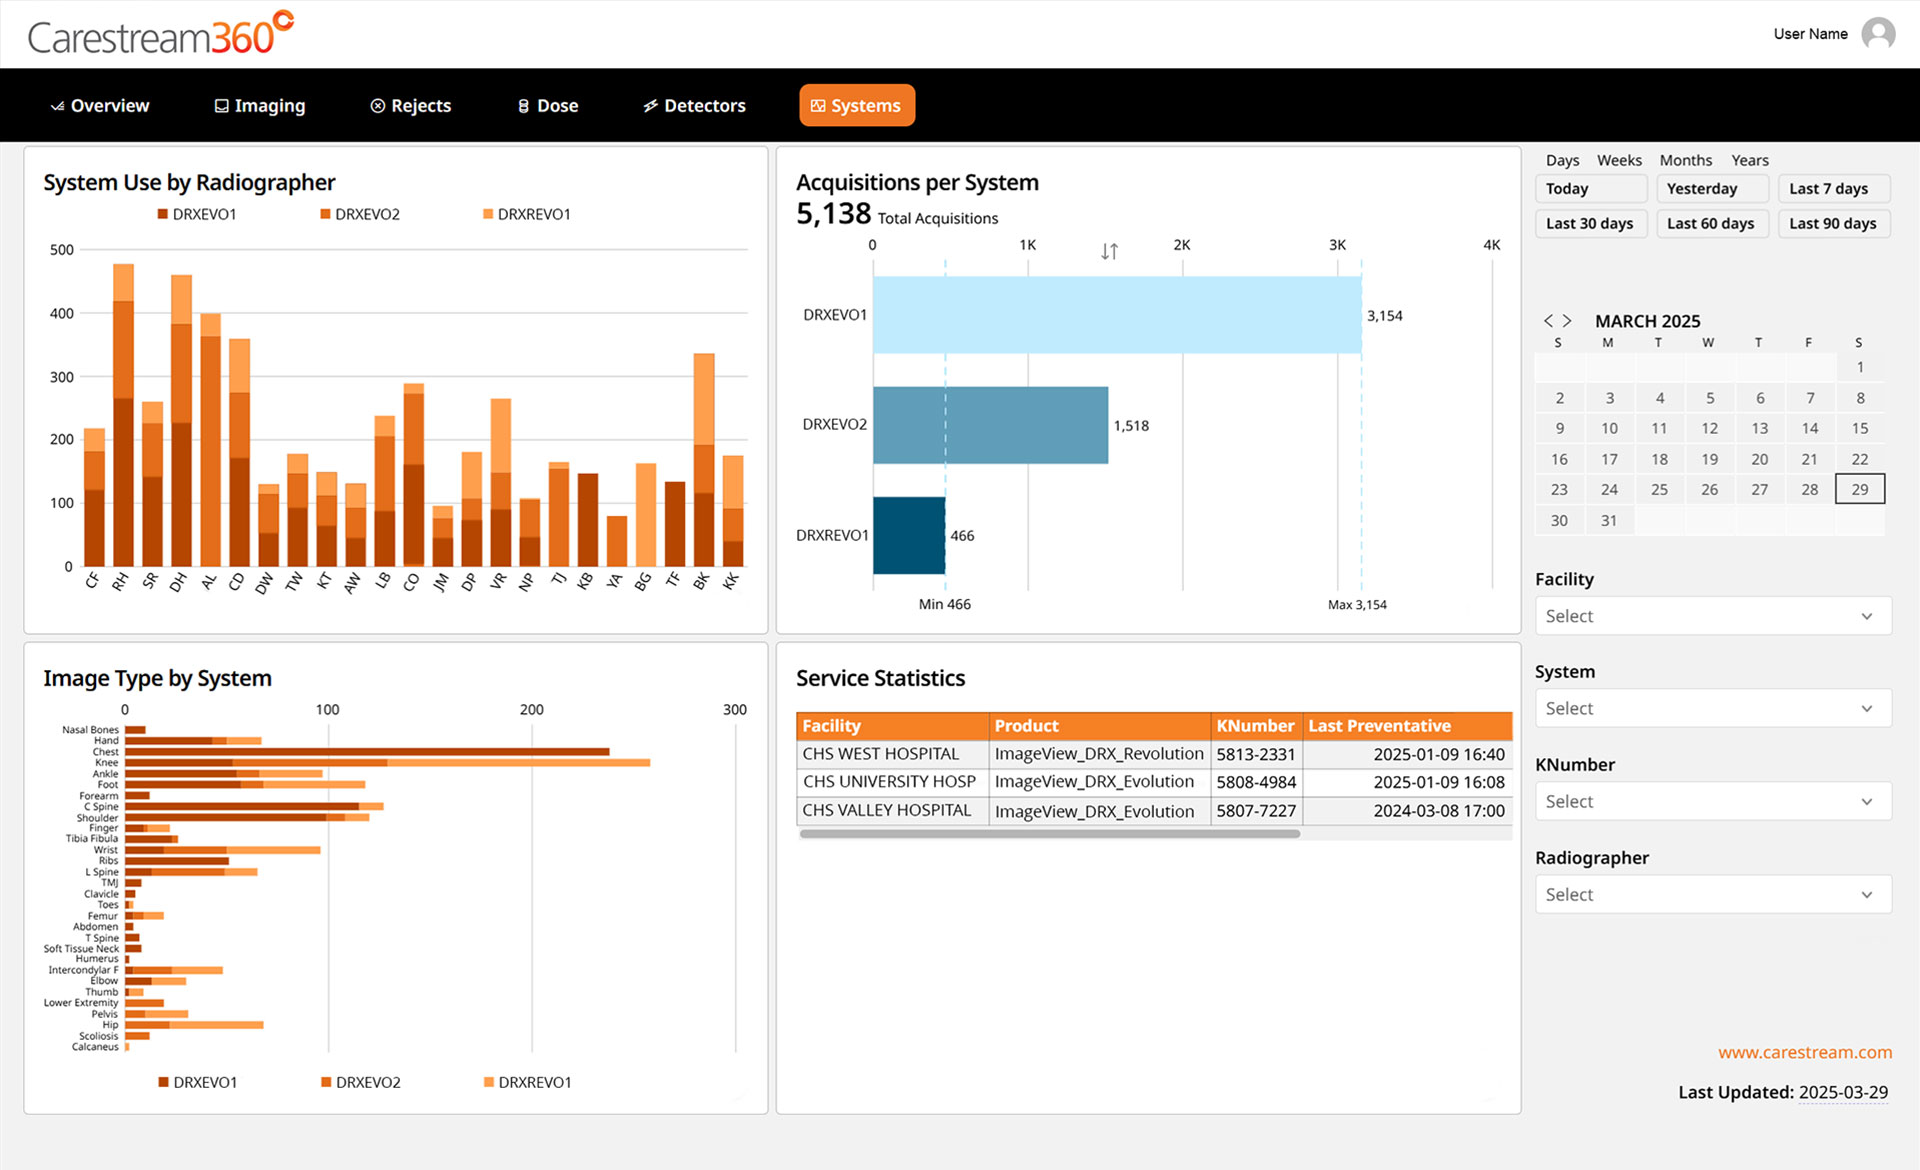
Track Utilization – Identify underused or overburdened systems to optimize resources effectively.
Monitor Radiographer Usage – Track usage patterns to ensure fair workload distribution across systems and staff.
Access Key System Information – View details like the last preventive maintenance date to ensure adherence to guidelines and easily access important system information when needed.
* Not all products and functionality are available in all countries, speak to your sales representative for details on availability.